Stress Concentration Factor: Minimizing Its Effects in Engineering
Stress concentration refers to localized regions of elevated stress in a material, often caused by geometric discontinuities, material defects, or external loading. The stress concentration factor is the ratio of maximum stress to nominal stress, quantifying the amplification of stress at a specific point. Kₜ is defined as the maximum stress at a discontinuity over the nominal stress acting on the same section in the absence of that discontinuity.
Key takeaways
Quick facts
The stress concentration factor indicates how many times higher the stress is at a hole or notch compared to the stress in the surrounding material.
Geometry decides the value. A sharp corner raises it; a generous fillet radius lowers it.
Most machine features lie between 1.5 and 5.5. A round hole in a wide plate under tension gives exactly 3.
Fatigue cracks begin where stress peaks, so the stress at a fillet or hole often determines how long the part lasts.
This guide explains what stress and stress concentration factors mean, what causes high local stresses, how to reduce them in practice, and how they are predicted with methods from FEA (Finite Element Analysis) to physics-aware AI.
The intended readers are stress analysts sizing components against static and fatigue limits, simulation professionals who evaluate local stress fields in FEA, and mechanical designers who set fillet radii and cutout geometry at the CAD stage.
If overlooked, stress concentration leads to premature failure, especially in components subjected to cyclic loading and fatigue. Turbine blades and engine parts demonstrate the consequences of an oversight at a fillet or bolt hole, which can lead to unexpected failures and safety hazards across automotive, civil, and aerospace applications.
Table of contents
What is stress? What is the stress concentration factor?
Effects of stress concentration
Causes of high stress concentration, notch sensitivity, and how to mitigate them
Simulation techniques and experimental methods
Emerging trends and conclusion
FAQ
Sources
What is stress? What is the stress concentration factor?
Stress (sigma, σ) is a fundamental concept in structural analysis. It is the internal resistance a structure develops per unit area when subjected to an external force.
It quantifies how much force F is acting on a given cross-section A:
σ = F / A
σ is classified into tensile σₜ (pulling), compressive σ𝚌 (pushing), shear τ (parallel, a key component in concentration problems around discontinuities), torsional τₜ (twisting) stress, and combinations such as bending (σ_b) (tensile on one side, compressive on the other. Structures often experience multiple σ types simultaneously (e.g., bending + shear in beams)

A stress concentration factor is a dimensionless number that quantifies how σ is amplified at geometric discontinuities, and its value is primarily a function of geometry rather than material properties.
Static loading typically uses the theoretical stress concentration factor Kₜ:
Kₜ = σ_max / σ_nominal
σ_max= maximum stress
σ_nominal = applied or nominal σ in the gross cross-section
For a particular nominal stress, the ratio of the highest σ at the critical discontinuity to σ_nominal defines the concentration factor.
Estimating stress concentration factors requires selecting a reference stress that represents the nominal loading condition in the absence of geometric irregularities. This reference stress, sometimes taken as the average stress, is the baseline for quantifying the amplification effect caused by features such as apertures or abrupt corners. Handbook values are tabulated against either the gross section or the net section, so a quoted Kₜ is meaningful only when the reference is stated.
The canonical result dates from 1898, when G. Kirsch solved the elastic stress field around a circular hole in a much larger plate. The factor-of-three stress concentration occurs at a hole under uniaxial loading, and the peak stress is located on the hole boundary at 90 degrees to the load direction. The value is independent of hole size and of the elastic constants of an isotropic material. Changing the remote stress state changes the factor: equibiaxial tension gives 2 around the whole circumference, and a Shear Stress state gives 4.
Engineers often start with design handbooks to relate geometry to SCF values; note that references such as Peterson's Stress Concentration Factors (Pilkey, Pilkey and Bi, 4th edition, Wiley, 2020) are commonly used before refining data with experiments or simulations. By comparing computed values with Stress Concentration Data, they predict localized peaks with FEA and modify designs to mitigate failure risks.
Typical stress concentration factors (Kₜ) range from about 1.5 to 5.5, depending on shape and loading. A circular aperture in a wide plate under tension gives exactly 3.0, and the value falls as the hole grows relative to the plate width, following the curve fit referenced to the net section:
Kₜ = 3.00 − 3.13(d/D) + 3.66(d/D)² − 1.53(d/D)³
A transverse hole in a round bar under tension starts at 3.0 for a vanishingly small hole and reaches approximately 5.5 at the upper limit of the tabulated range, referenced to the gross section. Shoulder fillets on shafts run from roughly 1.5 to 3.5 as the fillet radius decreases, and the same geometry returns different values for tension, bending, and torsion cases. Engineers refine these values through FEA and experiments to mitigate failure risks.
| Feature and loading | Kₜ | Notes |
|---|---|---|
| Circular hole in a wide plate, uniaxial tension | 3.0 | Kirsch, 1898. Peak on the hole boundary at 90 degrees to the load; independent of hole size and of the elastic constants |
| Circular hole in a wide plate, equibiaxial tension | 2 | Same value around the whole circumference |
| Circular hole in a wide plate, pure shear | 4 | The remote stress state, not the hole, sets the value |
| Circular hole in a plate of finite width, tension | Falls below 3.0 as d/D grows | Referenced to the net section, per the curve fit above |
| Transverse hole in a round bar, tension | 3.0 rising to about 5.5 | Referenced to the gross section; 3.0 for a vanishingly small hole |
| Shoulder fillet on a shaft | Roughly 1.5 to 3.5 | Rises as the fillet radius decreases; the same geometry returns different values in tension, bending and torsion |
| Elliptical hole, semi-axis a across the load | 1 + 2a/b | Inglis, 1913. A 3:1 ellipse reaches 7; a = b recovers 3.0 |
| Sharp notch or square-ended slot | Rises without limit | The root radius is the controlling variable, which is why semicircular ends are far less severe than square ends |
Effects of stress concentration
Stress concentration factors provide insights into potential weaknesses in a structure. The following industry examples show the consequences.
Automotive industry
In automotive engineering, components experience varying forces, which amplify stress concentrations and reduce lifespan.

The Ford Explorer/Firestone tire controversy shows how stress concentration affects safety. Tire tread separation stemmed from design flaws that created stress points. These factors led to severe tire failures, prompting improvements in tire design and testing methods. The U.S. Department of Transportation established the mechanism: belt-leaving-belt tread separations begin as belt-edge separation at the edge of the second steel belt, which is the area of highest strain in a steel-belted radial tire. That strain results from the structural discontinuity created by the abrupt change in modulus from steel to rubber, a stress raiser arising from a material transition rather than a machined feature. The cut ends of the steel cords add a second weakness, because the exposed bare steel adheres poorly to the surrounding rubber.
Two design dimensions govern the outcome. The belt wedge, a rubber strip placed between the belts at each shoulder, increases the inter-belt gauge in the critical belt-edge region and reduces the local strain. In the recalled and focus tires manufactured before May 1998, the wedge gauge was narrower than in peer tires. The shoulder pocket design raised stresses at the belt edge and further pinched the wedge gauge, producing a series of weak spots around the circumference. Firestone increased the wedge gauge and changed its material composition in March and April 1998.
On this subject, see also "Engineering Analysis Report and Initial Decision Regarding EA00-023: Firestone Wilderness AT Tires" by the U.S. Department of Transportation (October 2001).

Stress concentrations at tire defects, such as weak spots or belt separations, amplify local stresses, accelerating failure. The cumulative failure frequency curves separate the tires by plant and compare them with the Goodyear Wrangler RT/S fitted to many Explorers, whose curve stays essentially flat. The rising Firestone curves indicate age-dependent fatigue failures. The high failure rate suggests manufacturing flaws or material inconsistencies, and ODI measurements confirmed inter-belt gauges under the tread grooves far below the minimum design specification, where localized stress exceeds fatigue limits, leading to premature breakdown. As of March 2001, the Firestone claims database associated tread separations of the recalled and focus tires with 260 crashes, 367 injuries, and 74 fatalities.
Civil engineering
In civil engineering, structures are subjected to various environmental conditions and loads. Stress concentrations occur at connection points, changes in cross-section, or material discontinuities, potentially leading to failure under wind and traffic loading.
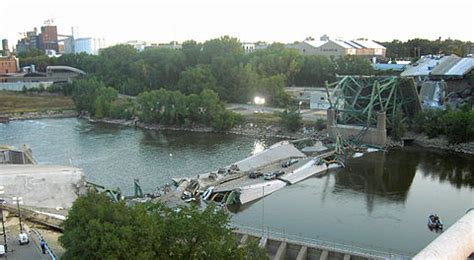
The 2007 I-35W Mississippi River Bridge collapse illustrates the long-term effects of stress concentration in structures and what happens when a connection detail carries more load than its section can develop. Investigations revealed overly thin gusset plates (see figure), creating stress points at vital connections. The NTSB determined the probable cause to be the inadequate load capacity of the gusset plates at the U10 nodes, which followed from a design error. Those plates measured 0.5 inches thick, approximately half the thickness required to carry the design forces. Thirteen people died, and 145 were injured.
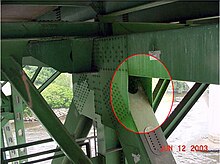
A gusset plate collects the forces of five truss members into a single connection, so the local stresses there exceed the member stresses reported by a one-dimensional influence line analysis. The initiating event was lateral instability at the upper end of the L9/U10W diagonal, after which the U10 plates fractured.
Aerospace
Abrupt geometric changes, such as corners, can create stress concentration points that can lead to catastrophic flight failures. For example, window cutouts are a specific stress riser in aircraft fuselages, and stress concentration factors are used extensively to design reinforced fuselage openings and, more broadly, bridge details. If not properly reinforced, the maximum stress approaches infinity at abrupt corners in the linear elastic idealization, risking structural failure, which is the reason a real corner yields or cracks instead. Fillets and composite materials reduce the highest to nominal stress ratio.
Causes of high stress concentration, notch sensitivity, and how to mitigate them
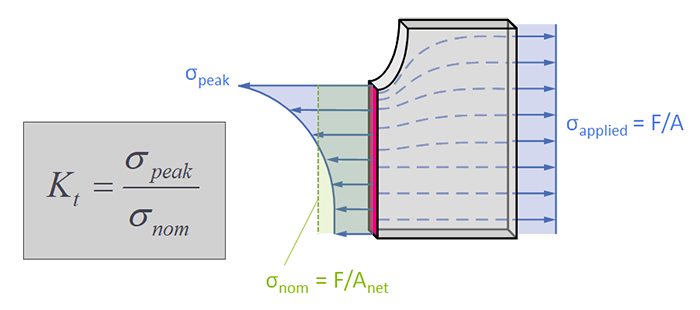
Sharp corners and notches cause localized stress due to abrupt changes in geometry, serving as examples of geometric stress raisers. Common stress concentrators in mechanical components include notches and sharp internal corners; a sharp corner increases the stress concentration factor, while larger fillet radii reduce it. The maximum value near a crack occurs at the point of minimum radius of curvature, and engineers often use curvature-based approaches to assess how this local geometry governs the peak. Inglis quantified this in 1913 for an elliptical hole of semi-axes a and b, where Kₜ = 1 + 2a/b = 1 + 2√(a/ρ), and ρ is the root radius, so the factor rises without limit as the root sharpens.

The Liberty ships of the Second World War provide the reference case. Approximately 52 percent of the serious fractures originated at the square corners of the cargo hatches, where a low-toughness steel operating below its ductile-to-brittle transition temperature met a geometric stress raiser, and the all-welded hull offered no rivet line to arrest a running crack. The remedies adopted were to round the hatch corners with welded reinforcement and to rivet crack-arrester straps into the deck.
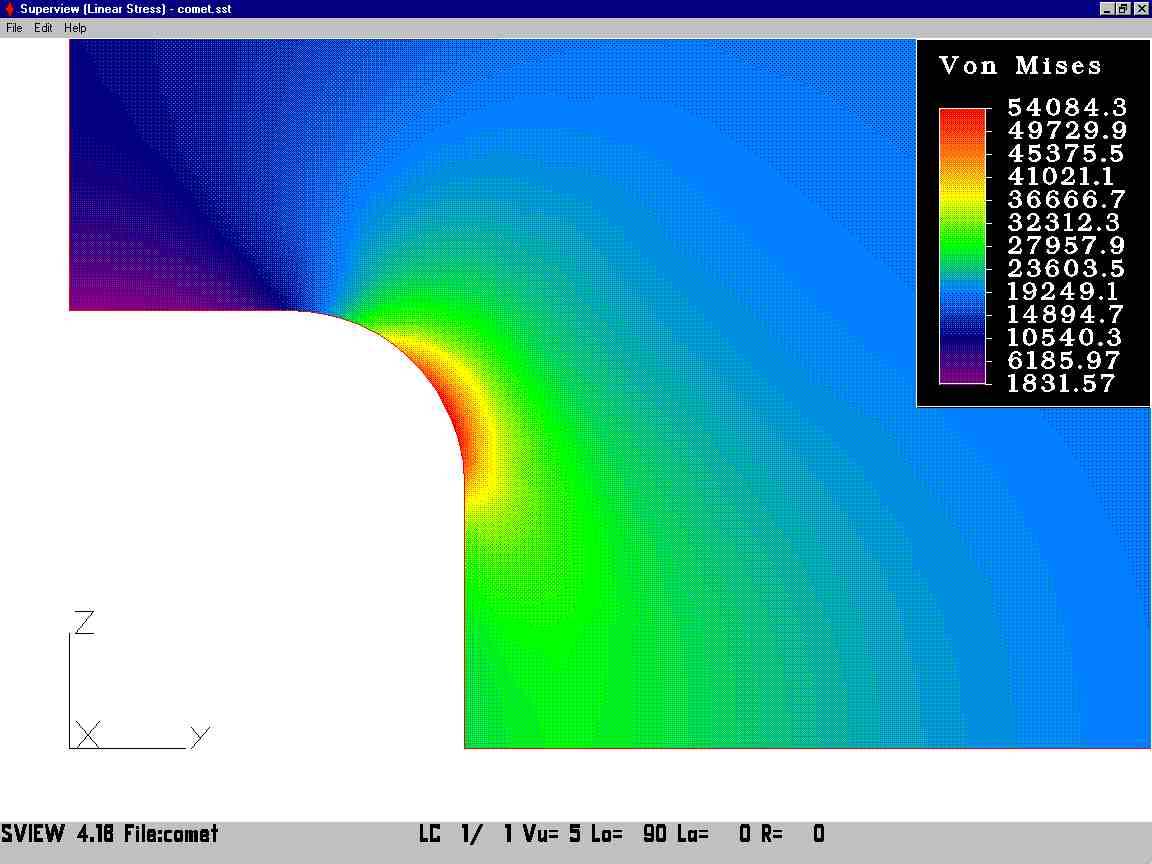
Holes and cutouts, such as drilled holes or slots, disrupt the stress flow. Stress concentrations also occur around features such as holes, notches, and keyways, and common examples include circular holes, screw threads, and sharp internal corners. The Comet jet crashes of 1954 illustrate the influence of cutout geometry, where the near-square corners of the fuselage openings acted as stress risers. The Royal Aircraft Establishment traced the fatigue crack in G-ALYP to a rivet hole at the corner of an automatic direction finder antenna window in the fuselage roof, and the water-tank test of G-ALYU failed at a corner of a forward escape hatch. Punch riveting, substituted for the bonded and riveted joint specified in the design, left imperfect holes that accelerated crack initiation.
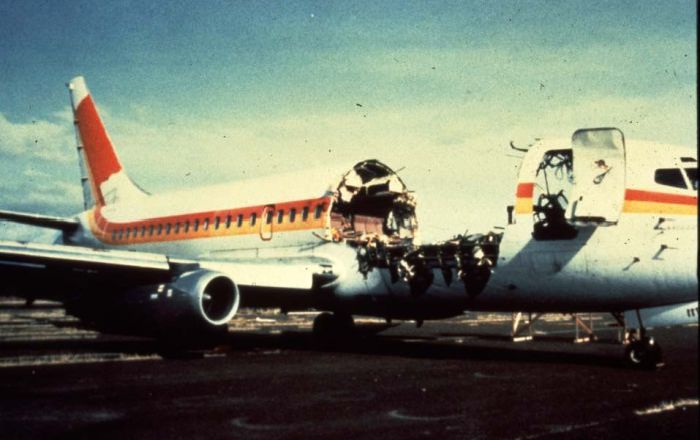
Material defects, such as inclusions or voids, create weak points. In the 1988 Aloha Airlines Flight 243 incident, crevice corrosion disbonded the adhesive in the fuselage lap joint at stringer S-10L, transferring the load to the rivets. Fatigue cracks around rivet holes then grew and linked up, a mechanism now designated multiple site damage, and contributed to fuselage failure. Approximately 18 feet of the upper fuselage separated at 24,000 feet. The airframe had accumulated 89,680 flight cycles against 35,496 flight hours, a ratio produced by short inter-island sectors.
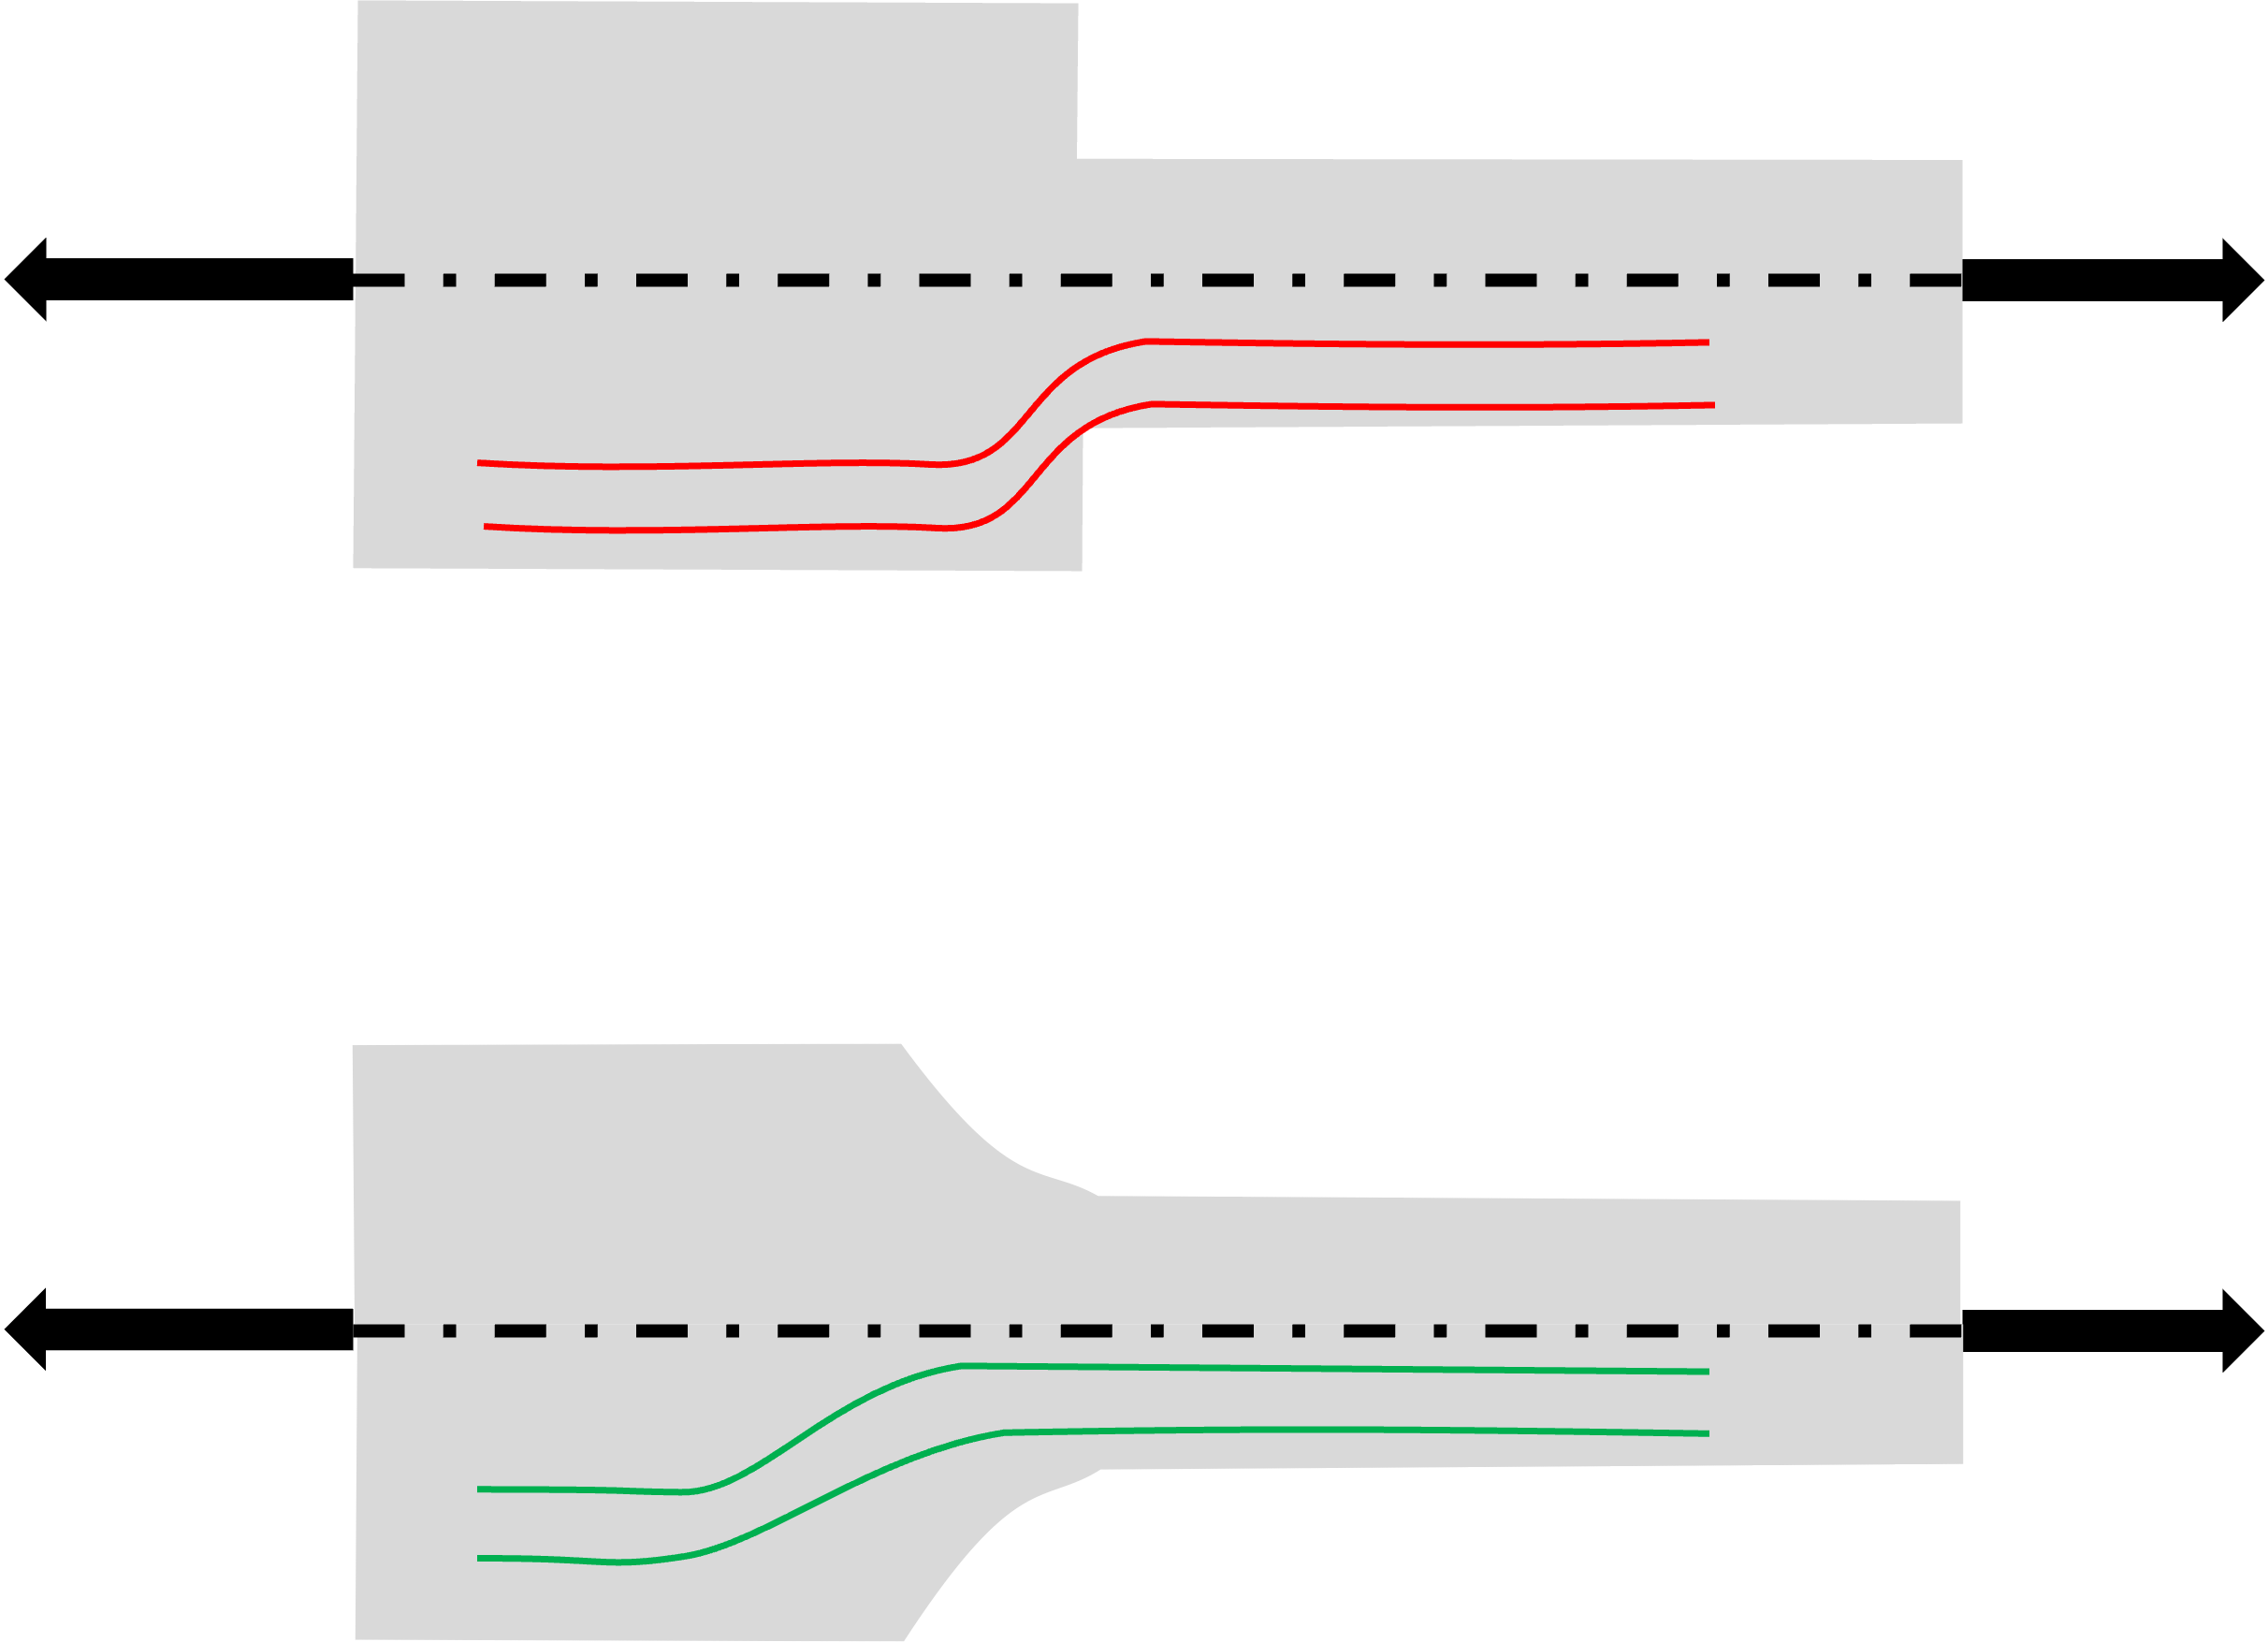
Abrupt cross-section changes, which are sudden thickness transitions, cause stress spikes. The magnitude depends on the ratio of the fillet radius to the smaller dimension, so a shoulder blended with a generous radius carries the same load at a much lower peak than a square step.
In summary, in regions with sharp geometric discontinuities, the highest stress can be larger than the applied load's effect on a uniform section. Higher values help predict fatigue life and prevent yielding, and under cyclic loading, they are closely linked to crack initiation and growth, making fatigue failure more likely.
How to reduce stress concentration?
Engineers optimize geometry to reduce local peak stresses through fillets, smooth transitions, and reinforced materials. Circular holes instead of diamond-shaped holes reduce stress concentration, and selective material removal can create gradual transitions that smooth stress flow while lowering peak stress; in some crack-arrest layouts, introducing a large hole increases the effective crack-tip radius and lowers the concentration.
Engineers can mitigate the impact of stress concentration by selecting materials with high fracture toughness and fatigue resistance.
Load redistribution helps achieve more balanced stress distributions
The top diagram (red) in the figure below illustrates a poor design with sharp corners that create severe concentrations, leading to crack initiation and fatigue failure during normal loading. The bottom diagram (green) shows gradual, rounded transitions that eliminate dangerous concentrations. For cyclic loading, the effective increase in fatigue damage is represented by the fatigue stress concentration factor Kբ, related to the geometric factor by Kբ = 1 + q(Kₜ − 1). The notch sensitivity value q measures a material's sensitivity to notches and ranges from 0 to 1. At q = 0, the material ignores the notch and Kբ = 1; at q = 1, the full geometric factor applies and Kբ = Kₜ. Low notch sensitivity means geometric discontinuities have less effect on fatigue damage. High-strength steels sit near the top of the range, while mild steels typically fall around 0.6 to 0.7. A key principle in mechanical design is avoiding abrupt corners and geometry changes, favoring gradual transitions with fillets to minimize stress concentrations.
CNC machining techniques can help reduce stress concentrations by designing stress-flow points, such as relief notches, and by reducing abrupt corners.
Simulation techniques and experimental methods
Finite Element Analysis (FEA) simulates structural stress distribution and fluid-structure interaction. A key application is computing stress concentration factors for complex geometries, helping engineers predict localized σ amplification caused by geometric features such as holes, notches, or sharp edges.
FEA handles complex geometries by breaking them into manageable elements and follows the equilibrium principle, where internal forces balance external loads
∑F_internal = ∑F_external.
FEA solves these equations iteratively and visualizes stress distribution, deformation, and displacement in 3D. Accuracy at a stress raiser depends on the mesh because the gradient is steep over a distance comparable to the root radius, and a mesh convergence study at the notch root is the standard check. Experimental methods such as photoelasticity and strain gauges are used to validate computed SCFs on physical parts or prototypes by comparing test and simulation results against reputable sources to assess the degree of agreement in the resulting factors.
Emerging trends and conclusion
Engineering Intelligence platforms are trained on past FEA analyses and associated CAD geometries to produce predictions accessible to all engineers, not only specialists, for addressing stress concentrations, such as in the design and optimization of turbo machinery, illustrating how AI in engineering improves design and decision-making.
Physics-aware AI shows the potential of AI used in mechanical engineering and broader artificial intelligence fields and applications. A model that recognizes geometry and physics can rank candidate fillet radii or cutout shapes at the point where the geometry is defined, before a mesh exists. Machine learning in mechanical engineering applies here because the quantity of interest, the peak stress at a discontinuity, depends on local geometry that changes at every design iteration.
As these systems evolve, they extend FEA to smaller organizations that previously lacked the resources for extensive FEA capabilities.
Predicting the peak before the mesh exists
Every case above turns on the same sequence: a discontinuity raised the local stress, and the design was released before anyone knew the peak. The handbook gives a value only for the idealised feature, and a solver gives the real one only once the geometry is frozen and meshed. What is missing is the number at the moment the fillet radius is chosen. A model trained on a company's own archive of FEA runs and the CAD geometries behind them returns predicted peak stress directly from the shape, which puts the answer inside the design step rather than after it. Neural Concept delivers this as an Intelligence Layer for Engineering for physical products, above the CAD and CAE tools already in use, with an AI Design Copilot that responds while the geometry is still open.
The effect is largest where a structural quantity gates the programme. General Motors applied it to pedestrian safety across 11 vehicle programmes, returning assessments in seconds where the simulation chain took weeks. Subaru cut die face shape analysis from three hours to two minutes. Neither replaces FEA; both change how many geometries can be judged before one is committed.
Ready to see the peak stress while the fillet is still a decision?
Explore the platform →FAQ
How are stress concentration factors measured experimentally?
Photoelasticity reveals σ patterns in transparent models using polarized light and colored fringes. Strain gauges measure deformation at critical points, allowing calculation of stress concentration factors.
What is the difference between the stress concentration factor and the stress intensity factor?
The stress concentration factor Kₜ and intensity factors KI/KII/KIII address different aspects. Kₜ quantifies local amplification due to geometric features in components. It is dimensionless and applies to elastic materials. Stress concentration factors help predict where cracks might initiate. The stress intensity factor is used in fracture mechanics for cracked components. It quantifies the severity of σ fields near crack tips and determines whether existing cracks will propagate. Different fracture modes (opening, sliding, tearing) have corresponding factors (KI, KII, KIII).
How do manufacturing processes introduce stress concentrations?
Machining, welding, or casting can introduce imperfections, such as sharp corners, surface roughness, or residual stresses, which act as concentrators.
Can AI replace FEA for predicting stress concentrations?
AI complements FEA in design departments. It predicts stress patterns rapidly and relies on FEA-generated training data, since it lacks the physics-based approach that makes FEA reliable in new situations.
What are "Peterson's Stress Concentration Factors"?
"Peterson’s Stress Concentration Factors" is a reference with empirical data and formulas for calculating Kₜ for various geometric features under tension, bending, or torsion. It includes charts and equations that help engineers estimate local stress increases. The fourth edition, published by Wiley in 2020, adds coverage of weld joints and composite materials, together with an introduction to systematic stress analysis using FEA.
What's the difference between the stress concentration factor and the factor of safety?
Kₜ is a geometric property that describes how much a discontinuity multiplies the nominal stress. It carries no judgment about whether the resulting stress is acceptable. The factor of safety is a design margin: the ratio of a limiting strength to the actual stress. The two enter the same calculation at different stages: Kₜ determines the peak stress, and the factor of safety compares that peak stress to the yield strength or endurance limit. A component can have a high Kₜ and still be safe when the nominal stress is low enough.
How does stress concentration affect ductile materials differently than brittle materials?
Under static loading, a ductile material yields locally at the notch root once the peak stress reaches the yield strength. The plastic zone redistributes the load into the surrounding material, and the component continues to carry the applied force; therefore, standard practice does not apply a stress concentration factor to ductile materials under static load. A brittle material provides no such relief because it fractures without appreciable yielding, so Kₜ must be applied in full. Cast iron is the recognized exception among brittle materials: its graphite flakes already act as internal discontinuities, and applying an additional geometric factor double-counts the effect. The distinction disappears under cyclic loading, where fatigue cracks also initiate at notch roots in ductile materials.
How does the stress concentration factor compare for a circular hole vs. an elliptical hole in a plate?
A circular hole is the special case of an ellipse with equal axes, and it gives Kₜ = 3.0 in a wide plate under uniaxial tension. For an elliptical hole with semi-axis a perpendicular to the load and semi-axis b parallel to it, Inglis gives Kₜ = 1 + 2a/b. Setting a = b recovers the value of 3. An ellipse elongated across the load direction raises the factor steeply, so a 3:1 ellipse reaches 7, while an ellipse elongated along the load direction reduces it, because the geometry interferes less with the stress flow. The controlling variable is the root radius rather than the hole area, which is why a slot with semicircular ends is far less severe than a slot of the same length with square ends.
How does the proximity of multiple holes in a plate affect the overall stress concentration factor?
The interaction depends on the spacing between holes and on their orientation relative to the load. Holes arranged in a line perpendicular to the load share a narrow ligament through which the diverted stress flow must pass, and the peak stress in that ligament exceeds the isolated-hole value. Holes arranged along the load direction interfere less because each falls in the reduced-stress region alongside its neighbor, and the factor can drop below the isolated-hole value. The interaction weakens as spacing increases and becomes negligible at a center-to-center distance of several diameters. Peterson treats the case explicitly under the interaction effect of neighboring holes, and perforated plate patterns are characterized by ligament efficiency rather than by a single hole factor.
Sources
G. Kirsch, Die Theorie der Elastizität und die Bedürfnisse der Festigkeitslehre, Zeitschrift des Vereines deutscher Ingenieure, 1898 — the elastic field around a circular hole, and the factor of three.
C. E. Inglis, Stresses in a Plate Due to the Presence of Cracks and Sharp Corners, Transactions of the Institution of Naval Architects, 1913 — the elliptical hole and Kₜ = 1 + 2a/b.
W. D. Pilkey, D. F. Pilkey and Z. Bi, Peterson's Stress Concentration Factors, 4th edition, Wiley, 2020.
National Transportation Safety Board, Collapse of I-35W Highway Bridge, Minneapolis, Minnesota, August 1, 2007, Highway Accident Report NTSB/HAR-08/03.
National Highway Traffic Safety Administration, Engineering Analysis Report and Initial Decision Regarding EA00-023: Firestone Wilderness AT Tires, October 2001.
Federal Aviation Administration, Lessons Learned from Transport Airplane Accidents, Aloha Airlines Flight 243, 28 April 1988.
Appendix — notation
σ — normal stress, force per unit area; σₜ tensile, σ𝚌 compressive, σ_b bending
τ — shear stress; τₜ torsional shear
Kₜ — theoretical (geometric) stress concentration factor, σ_max divided by σ_nominal
Kբ — fatigue stress concentration factor, the effective factor under cyclic loading
q — notch sensitivity, from 0 (notch ignored) to 1 (full geometric factor applies)
ρ — notch root radius
SCF — stress concentration factor
K_I, K_II, K_III — stress intensity factors for the opening, sliding and tearing fracture modes
FEA — finite element analysis
MSD — multiple site damage, the linking up of fatigue cracks from adjacent holes
ODI — Office of Defects Investigation, NHTSA